
Szymon Kaliski
The new Console has been launched for a while, bringing a whole new UI, persisted history of executions, metadata about the runs, and more!
Let’s take a tour of where it came from, how it works, and how it was built.
Brief history
In the past, the Console looked very similar to the Shell and, depending on the Repl configuration, sometimes behaved like one:
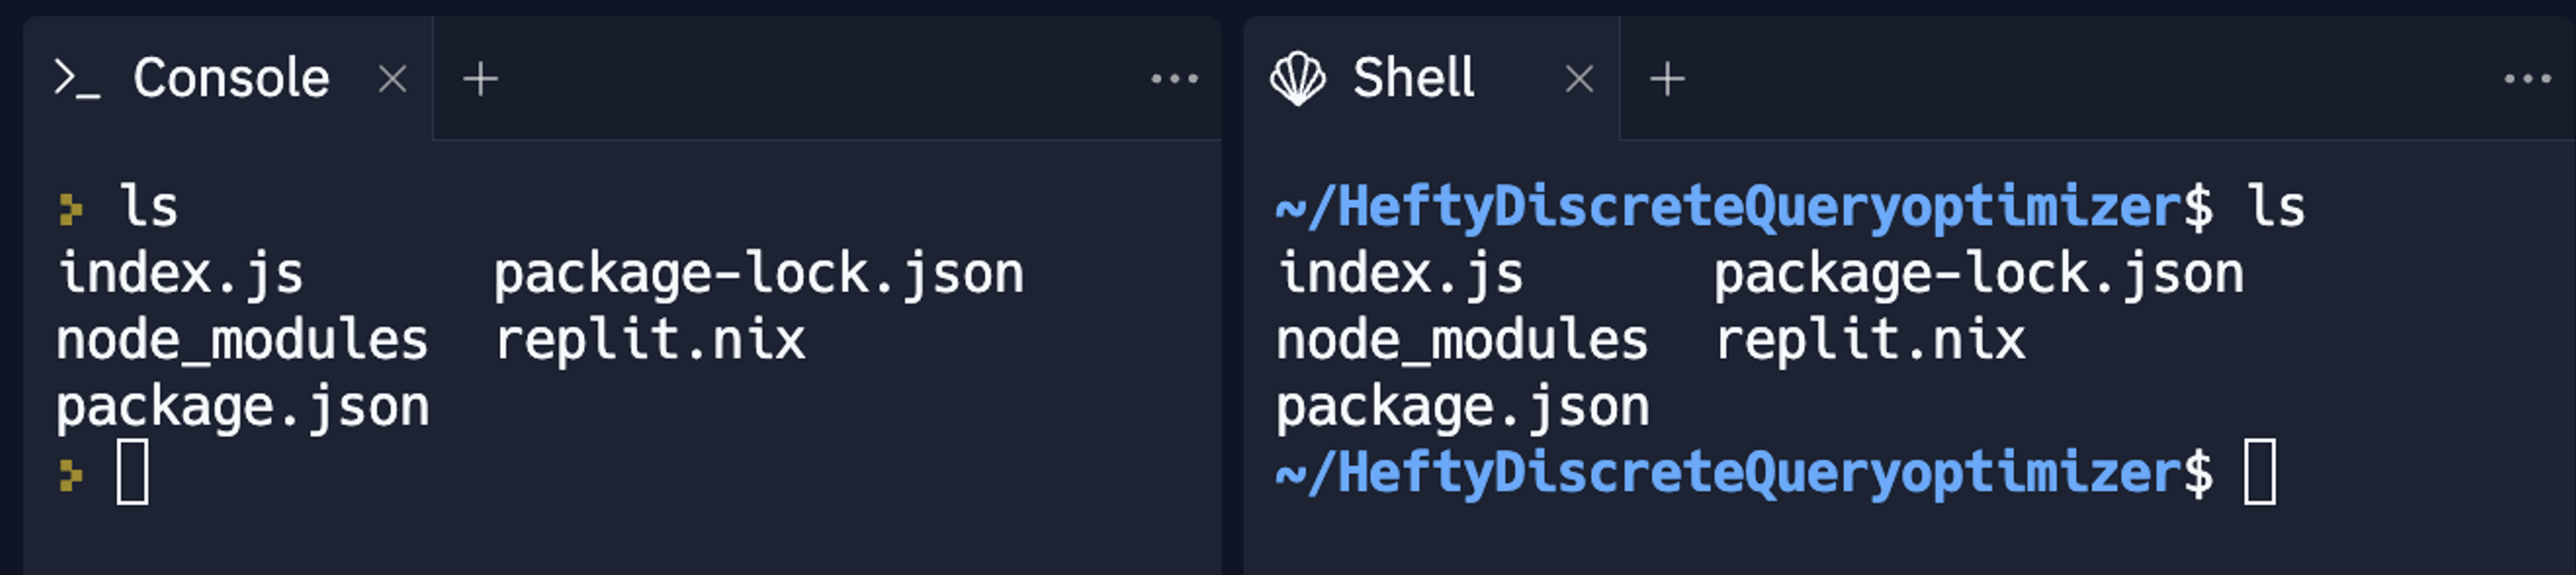
...and sometimes did not:
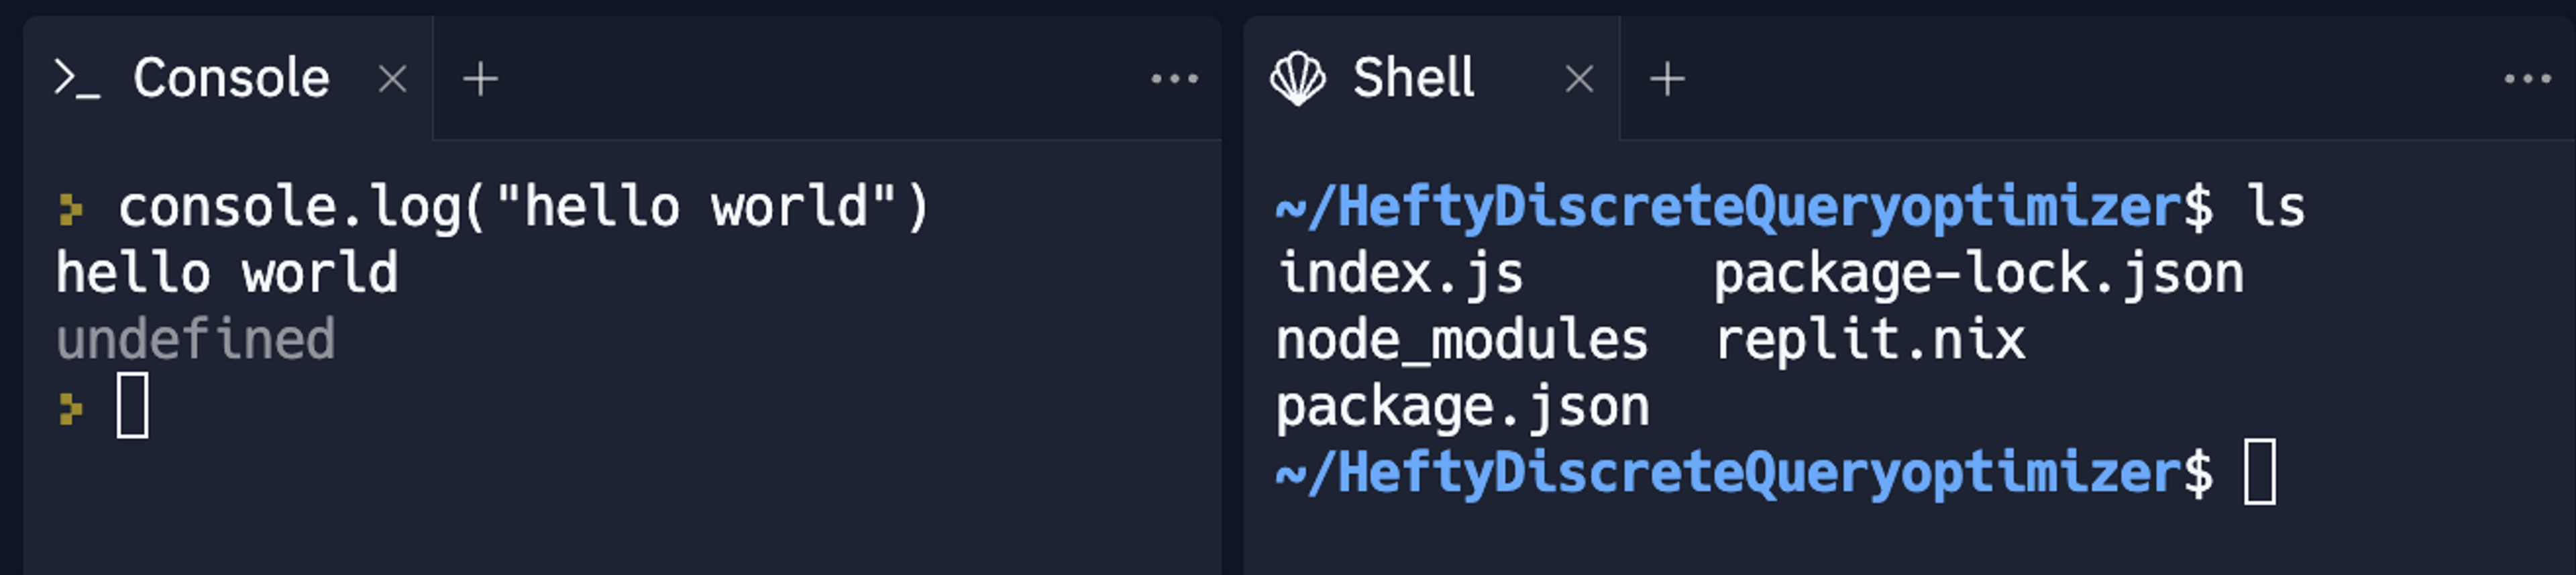
(Notice how, in the first case, the Console interprets shell commands, and in the second case, is a Node Repl)
This behavior was based on the .replit configuration and the state of the Repl (if the code is running or not), and was impossible to fully predict by just looking at the interface, which often led to confusion and sub-par user experience.
The Console was also cleared on every project run, making it impossible to see past results and making understanding and debugging your programs harder.
Packager installations were also displayed in the Console, which could lead to users either missing possible issues (since they were cleaned before the code was executed) or even intertwined code and packager output text, which led to even more confusion.
With this project, we aimed to solve all of these issues simultaneously while adding new features to the pane as well.
New Console walkthrough
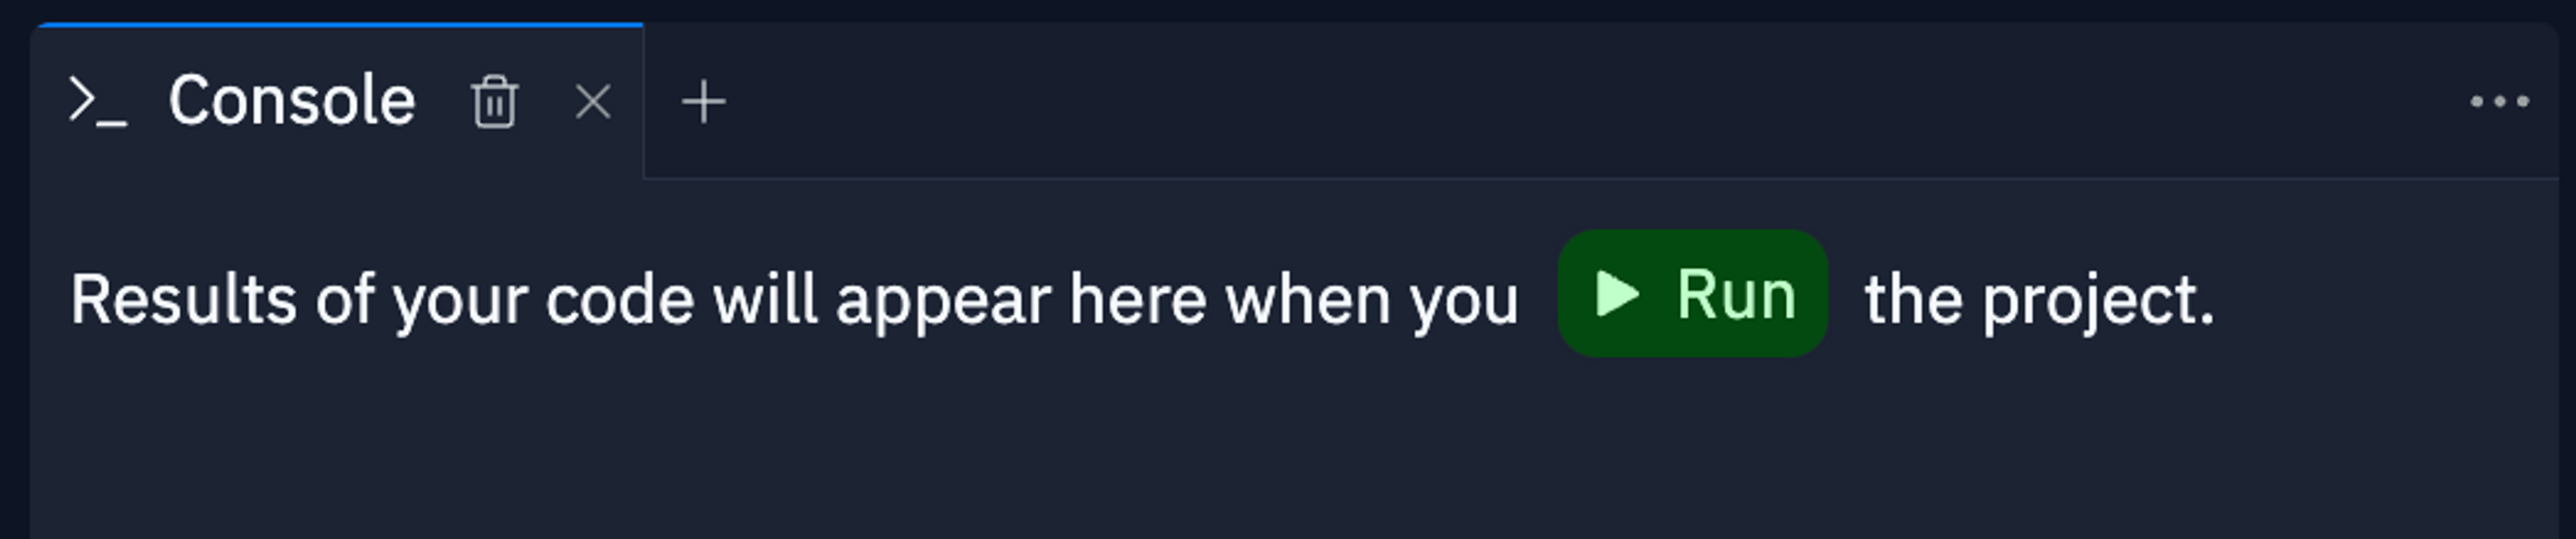
The first thing you’ll notice is that the new Console is concerned only with the results of your code's execution. If the Repl is not running, you won’t see a Shell-like prompt anymore:
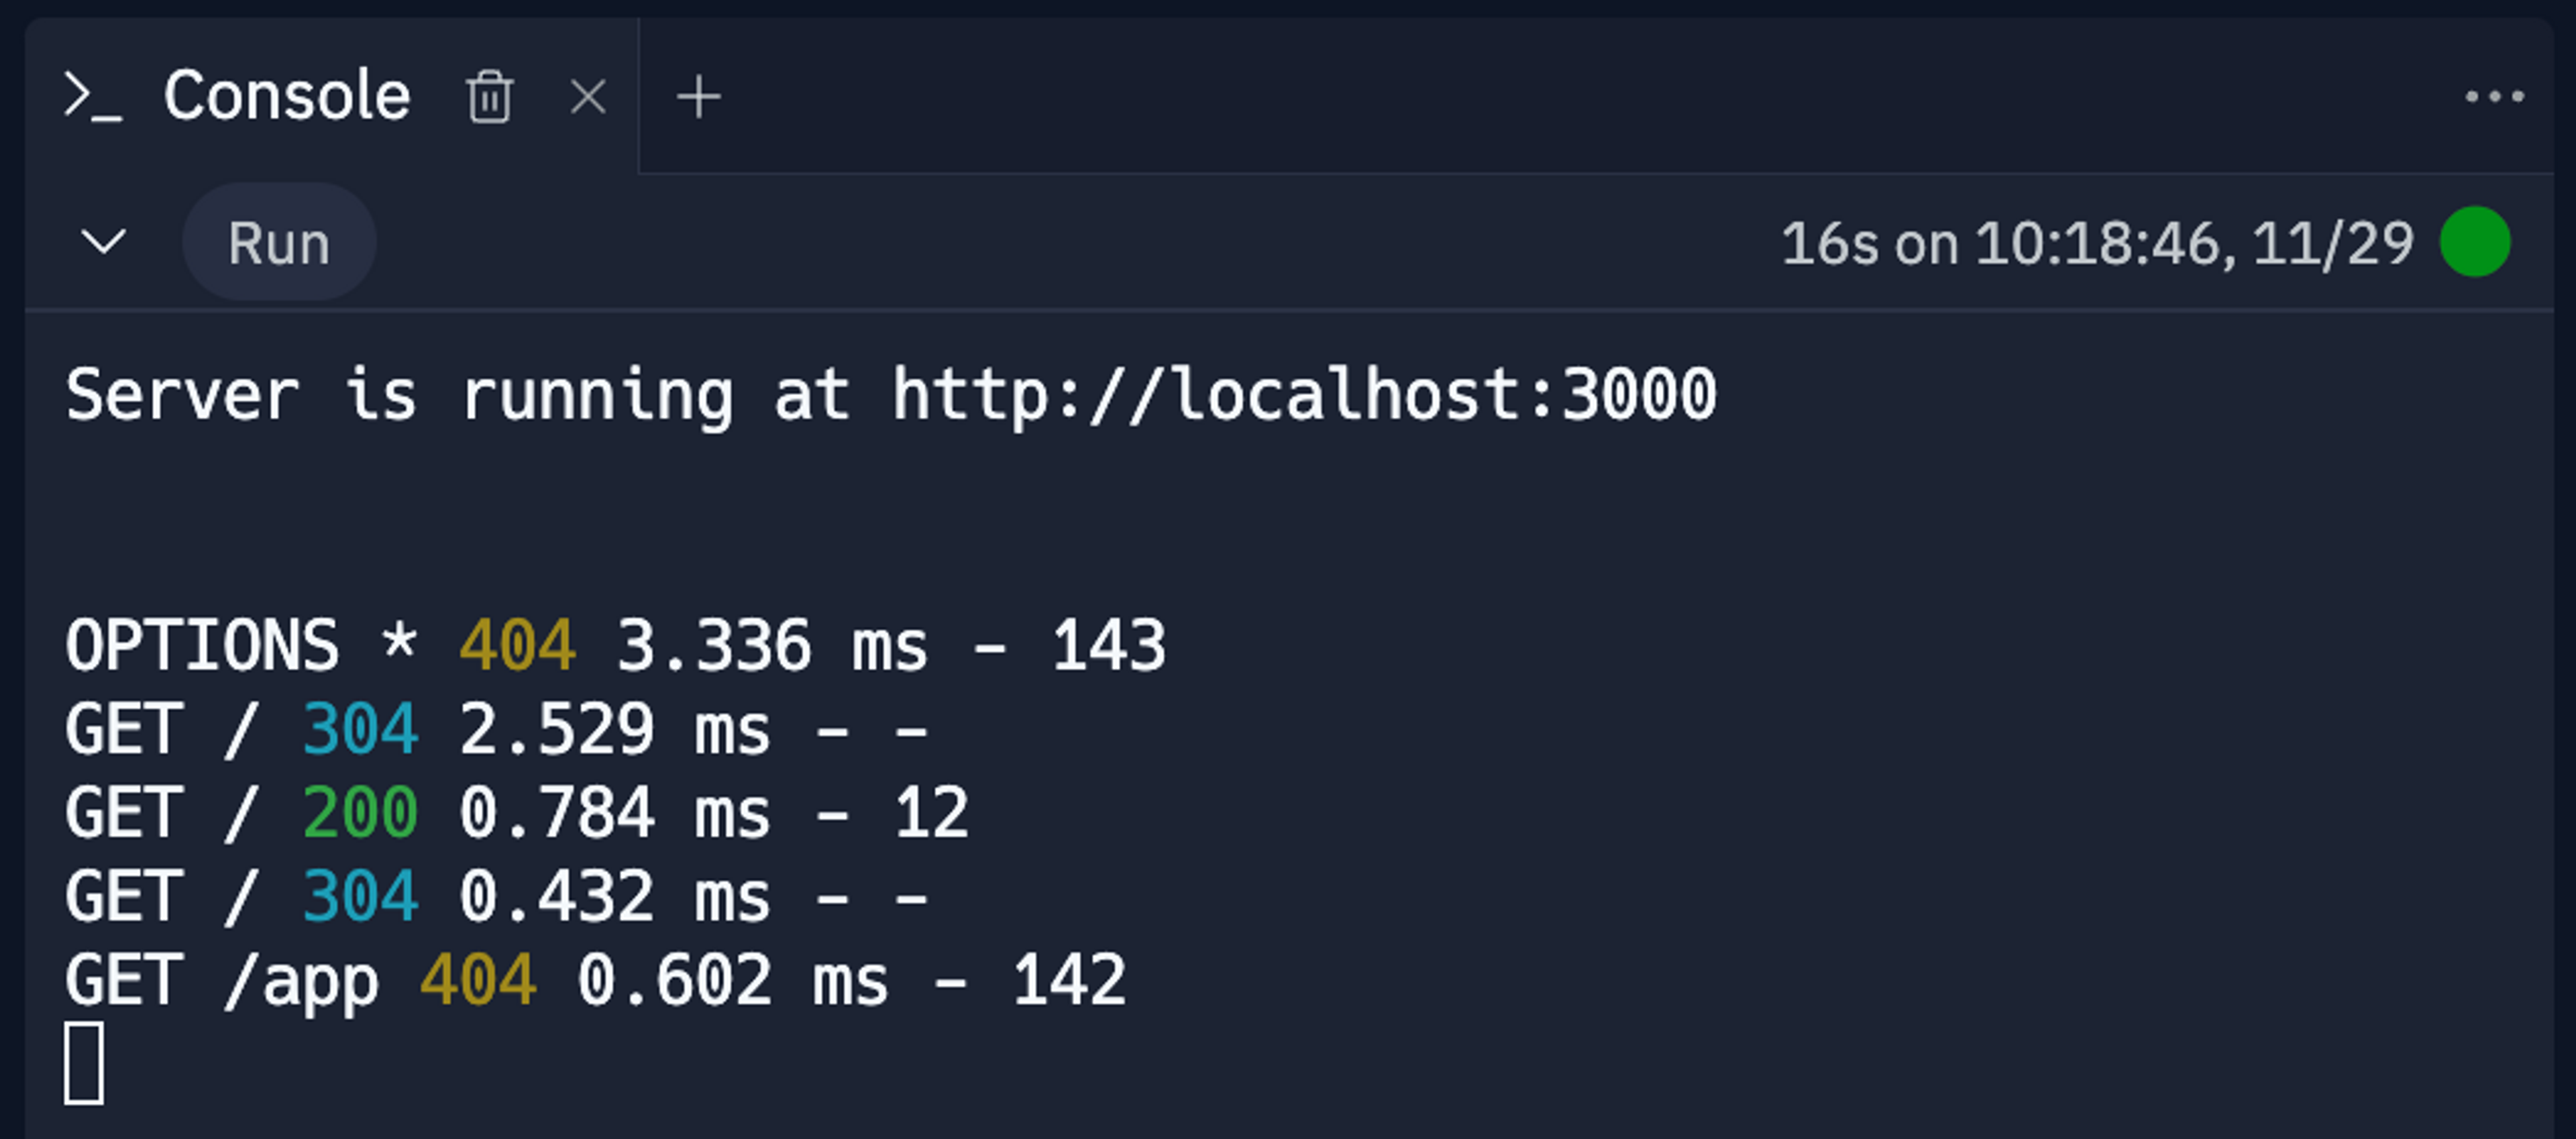
Every time you run the Repl, a new Console “block” is created. The top line displays metadata: the kind of thing that’s running (more on this in a bit), how long the command took (16s so far in this example), when it was started, and its status:
Consecutive runs create their own “blocks,” so the history of evaluated commands is preserved:
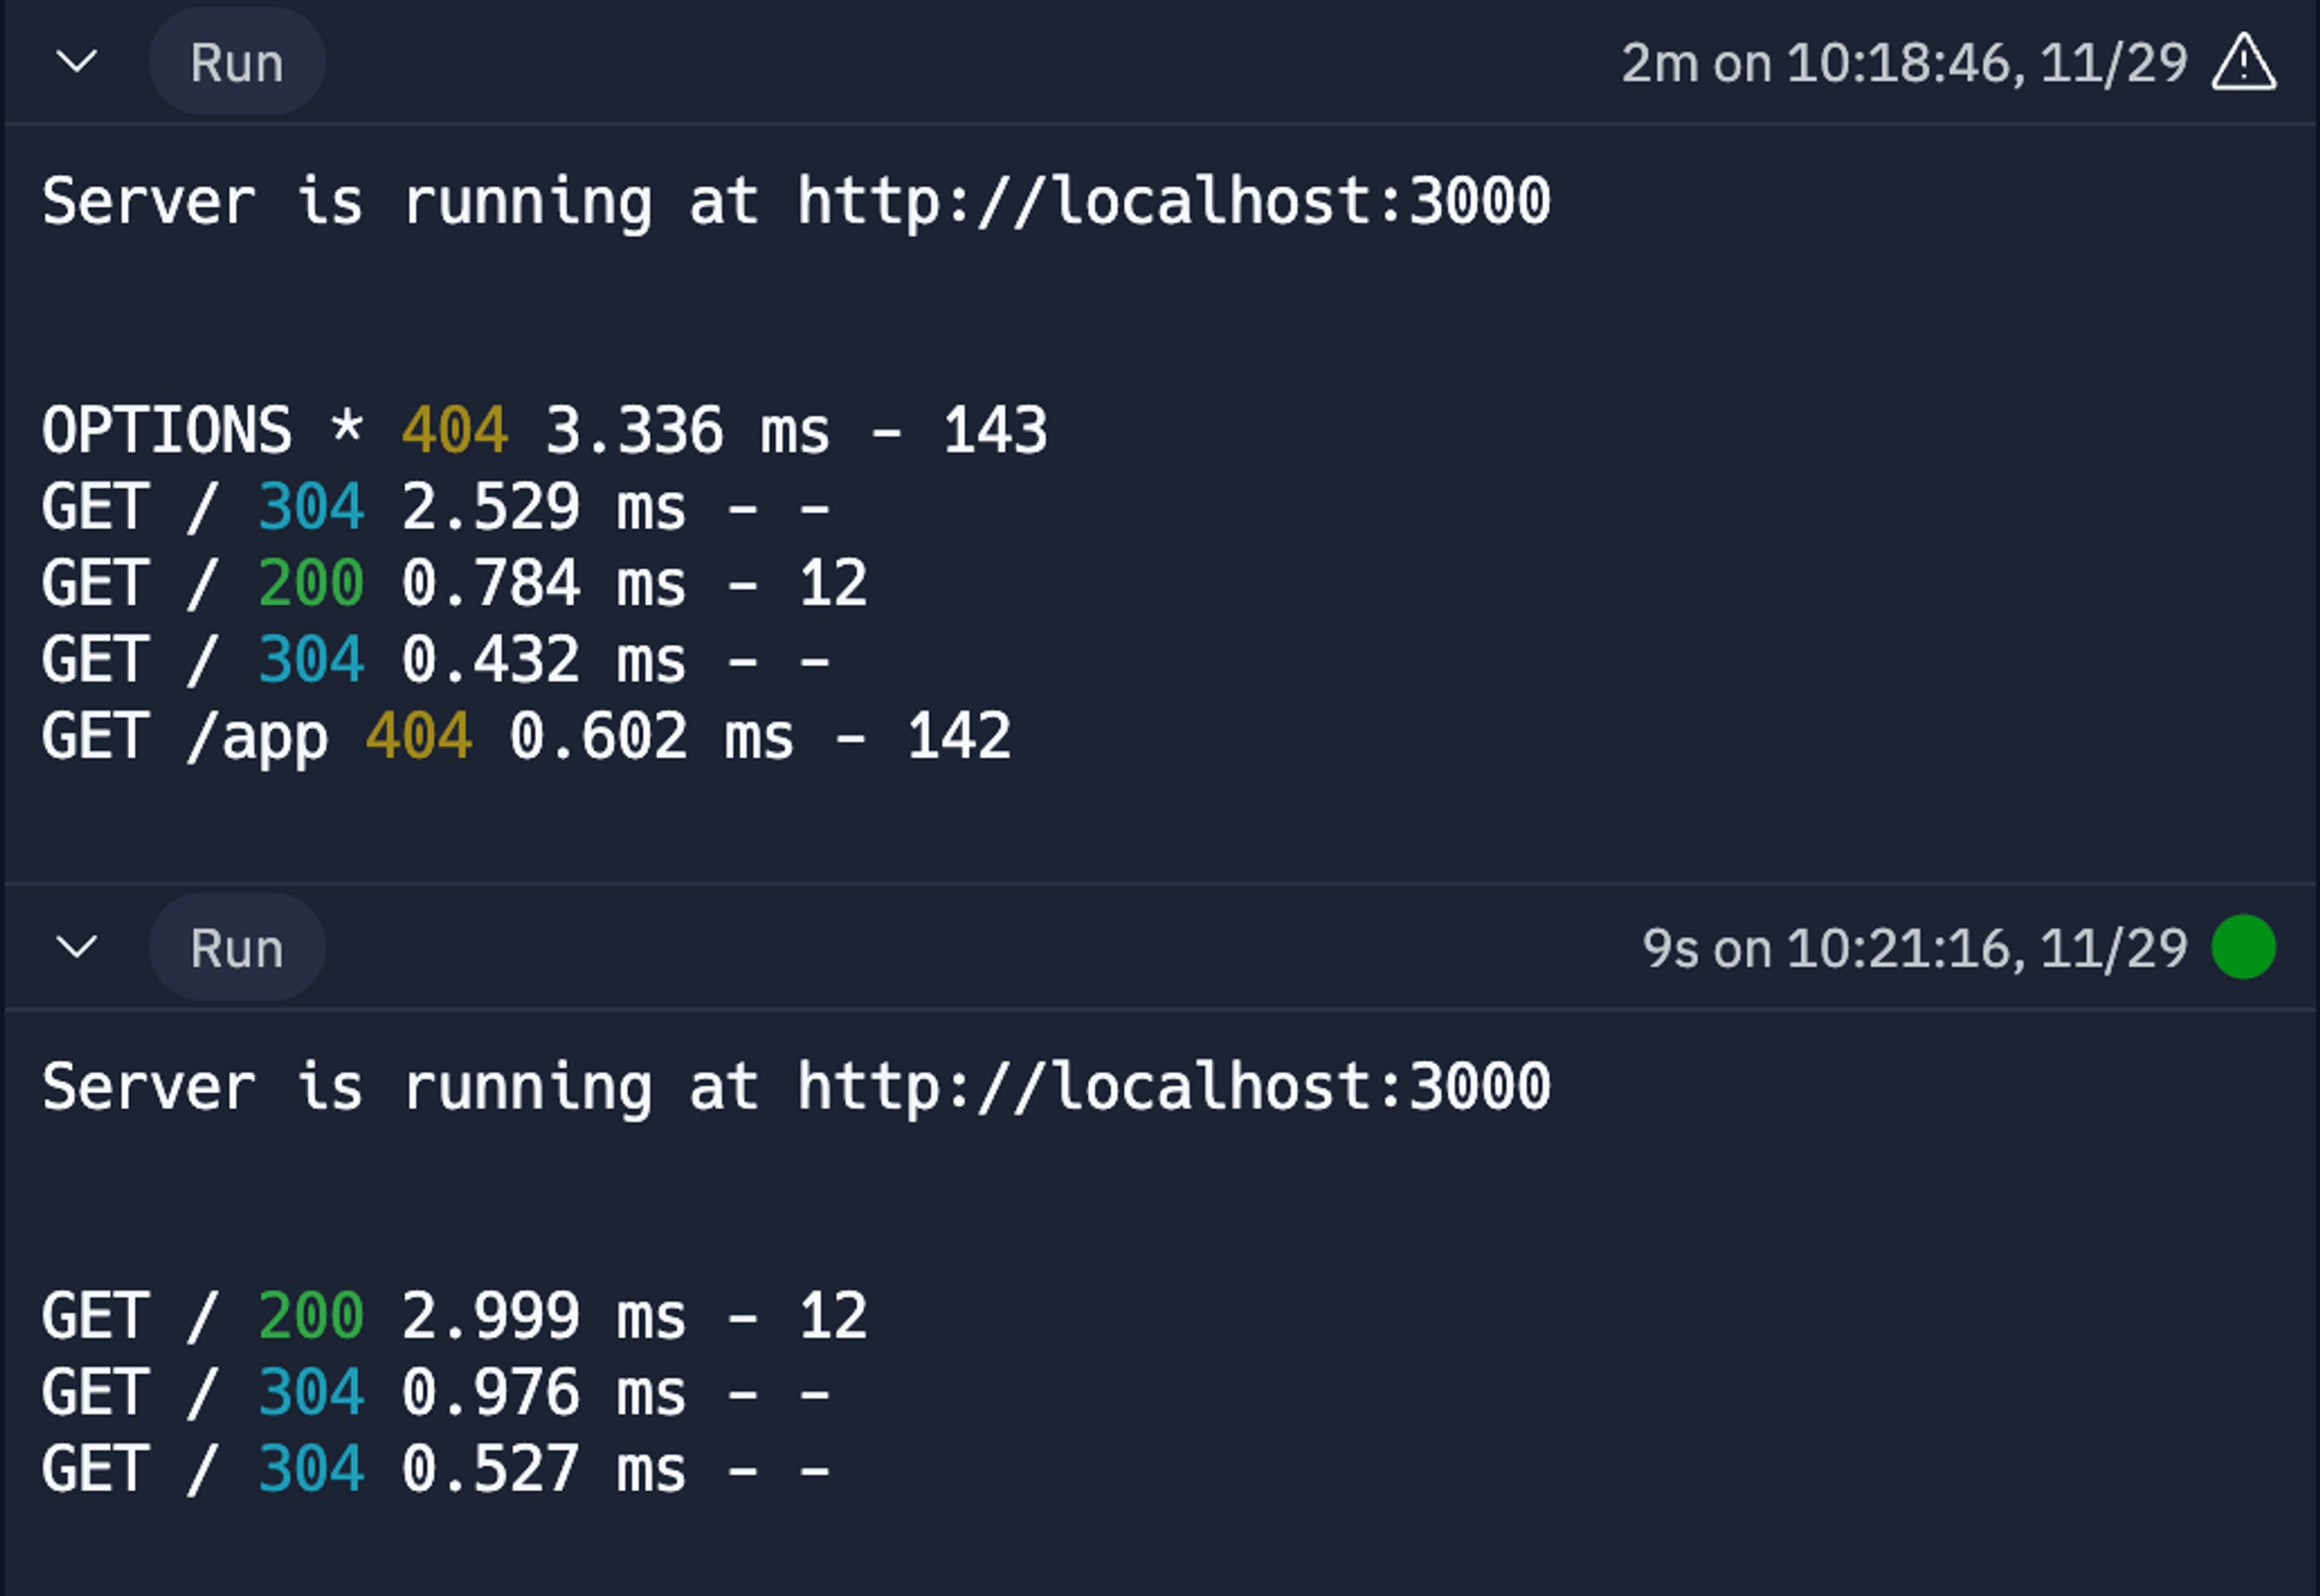
The history can be very useful – for example, when iteratively building up a program or comparing changes made between multiple evaluations – but it can also sometimes get overwhelming.
For this, you can do both: collapse the blocks you’re not interested in or clear the history completely:
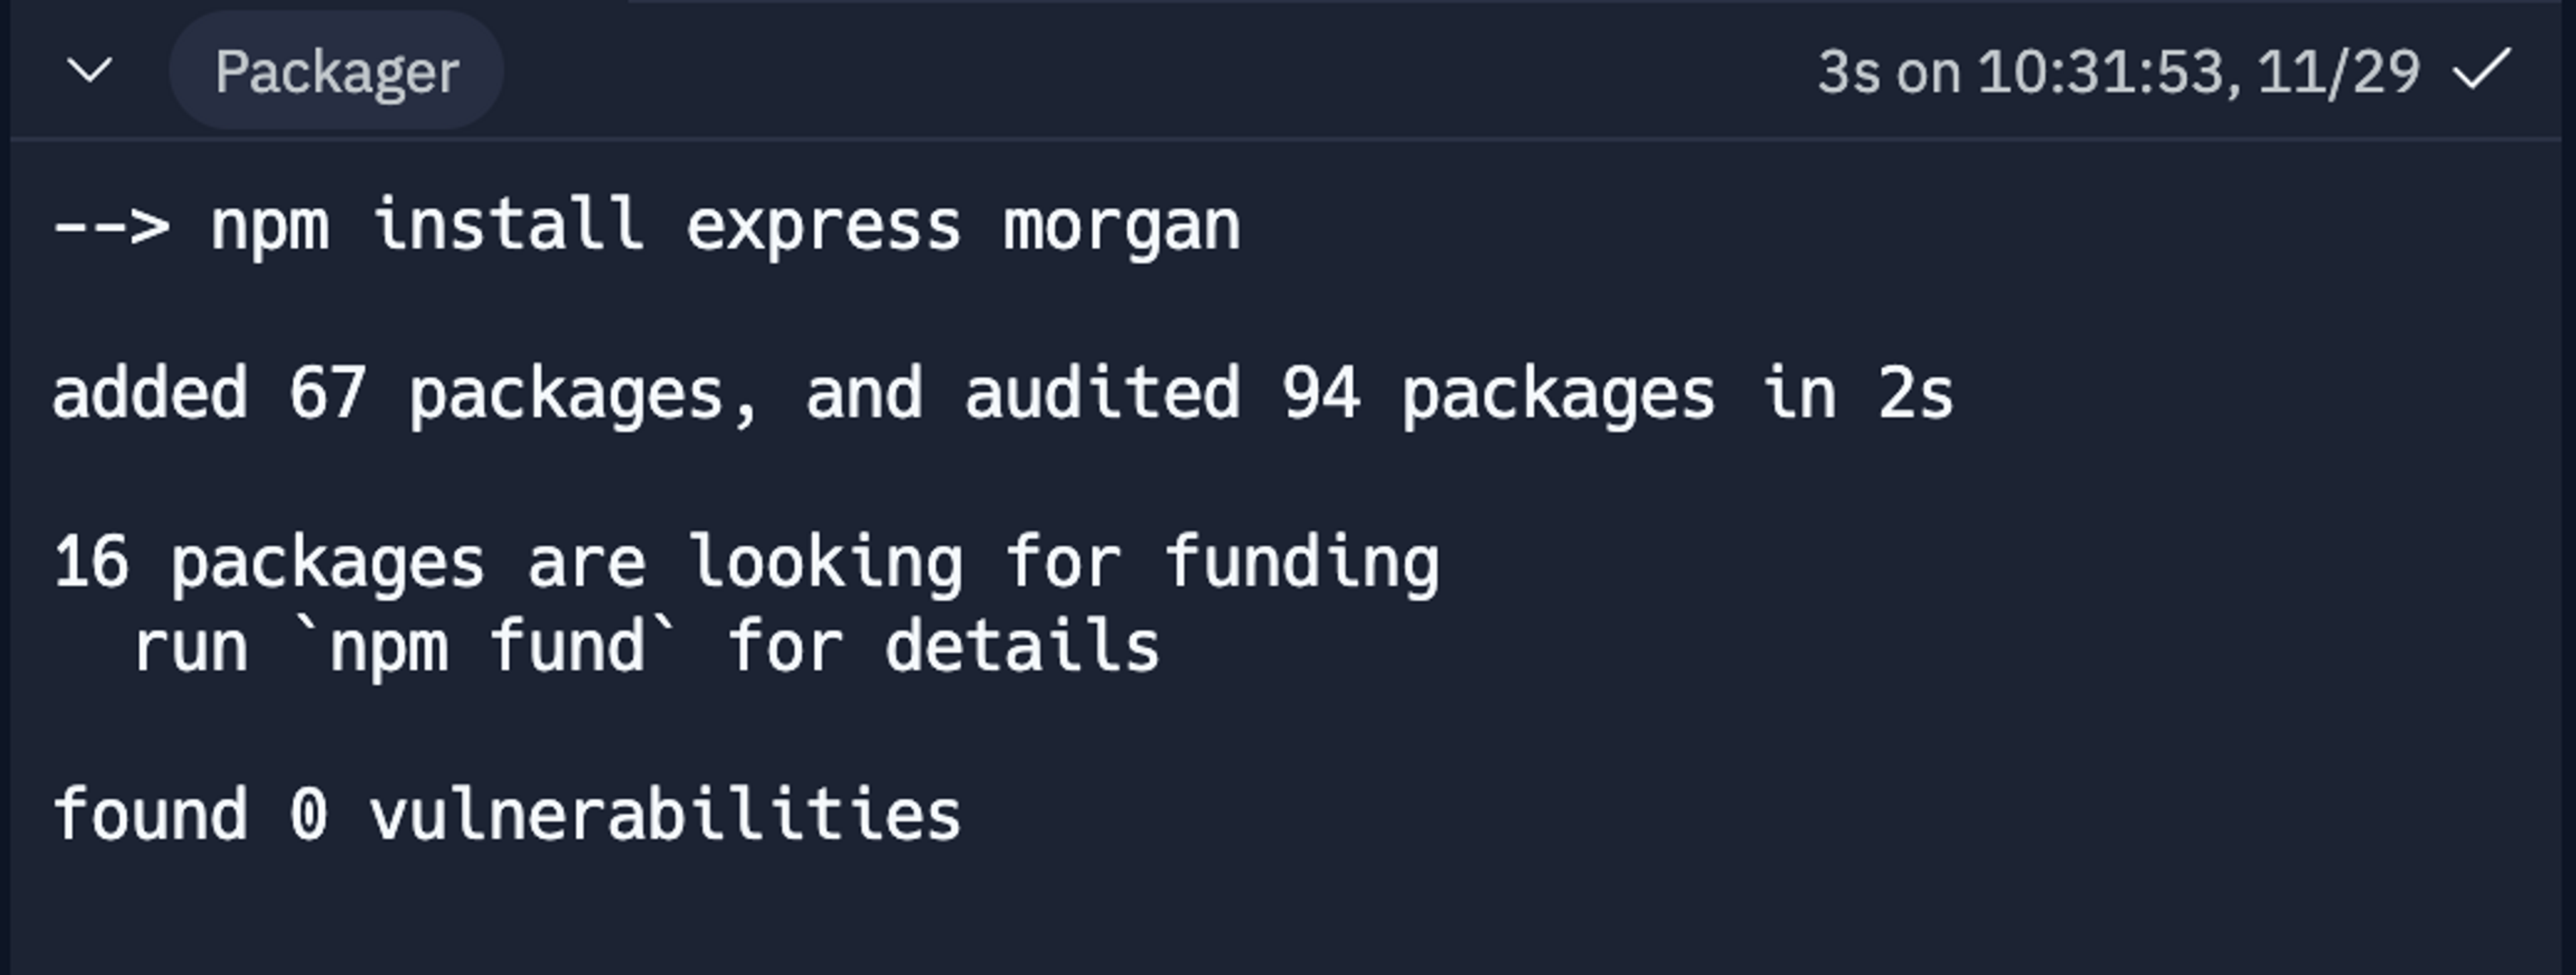
In addition to seeing the output of your code, the Console is also integrated with the Package Manager and the Debugger:

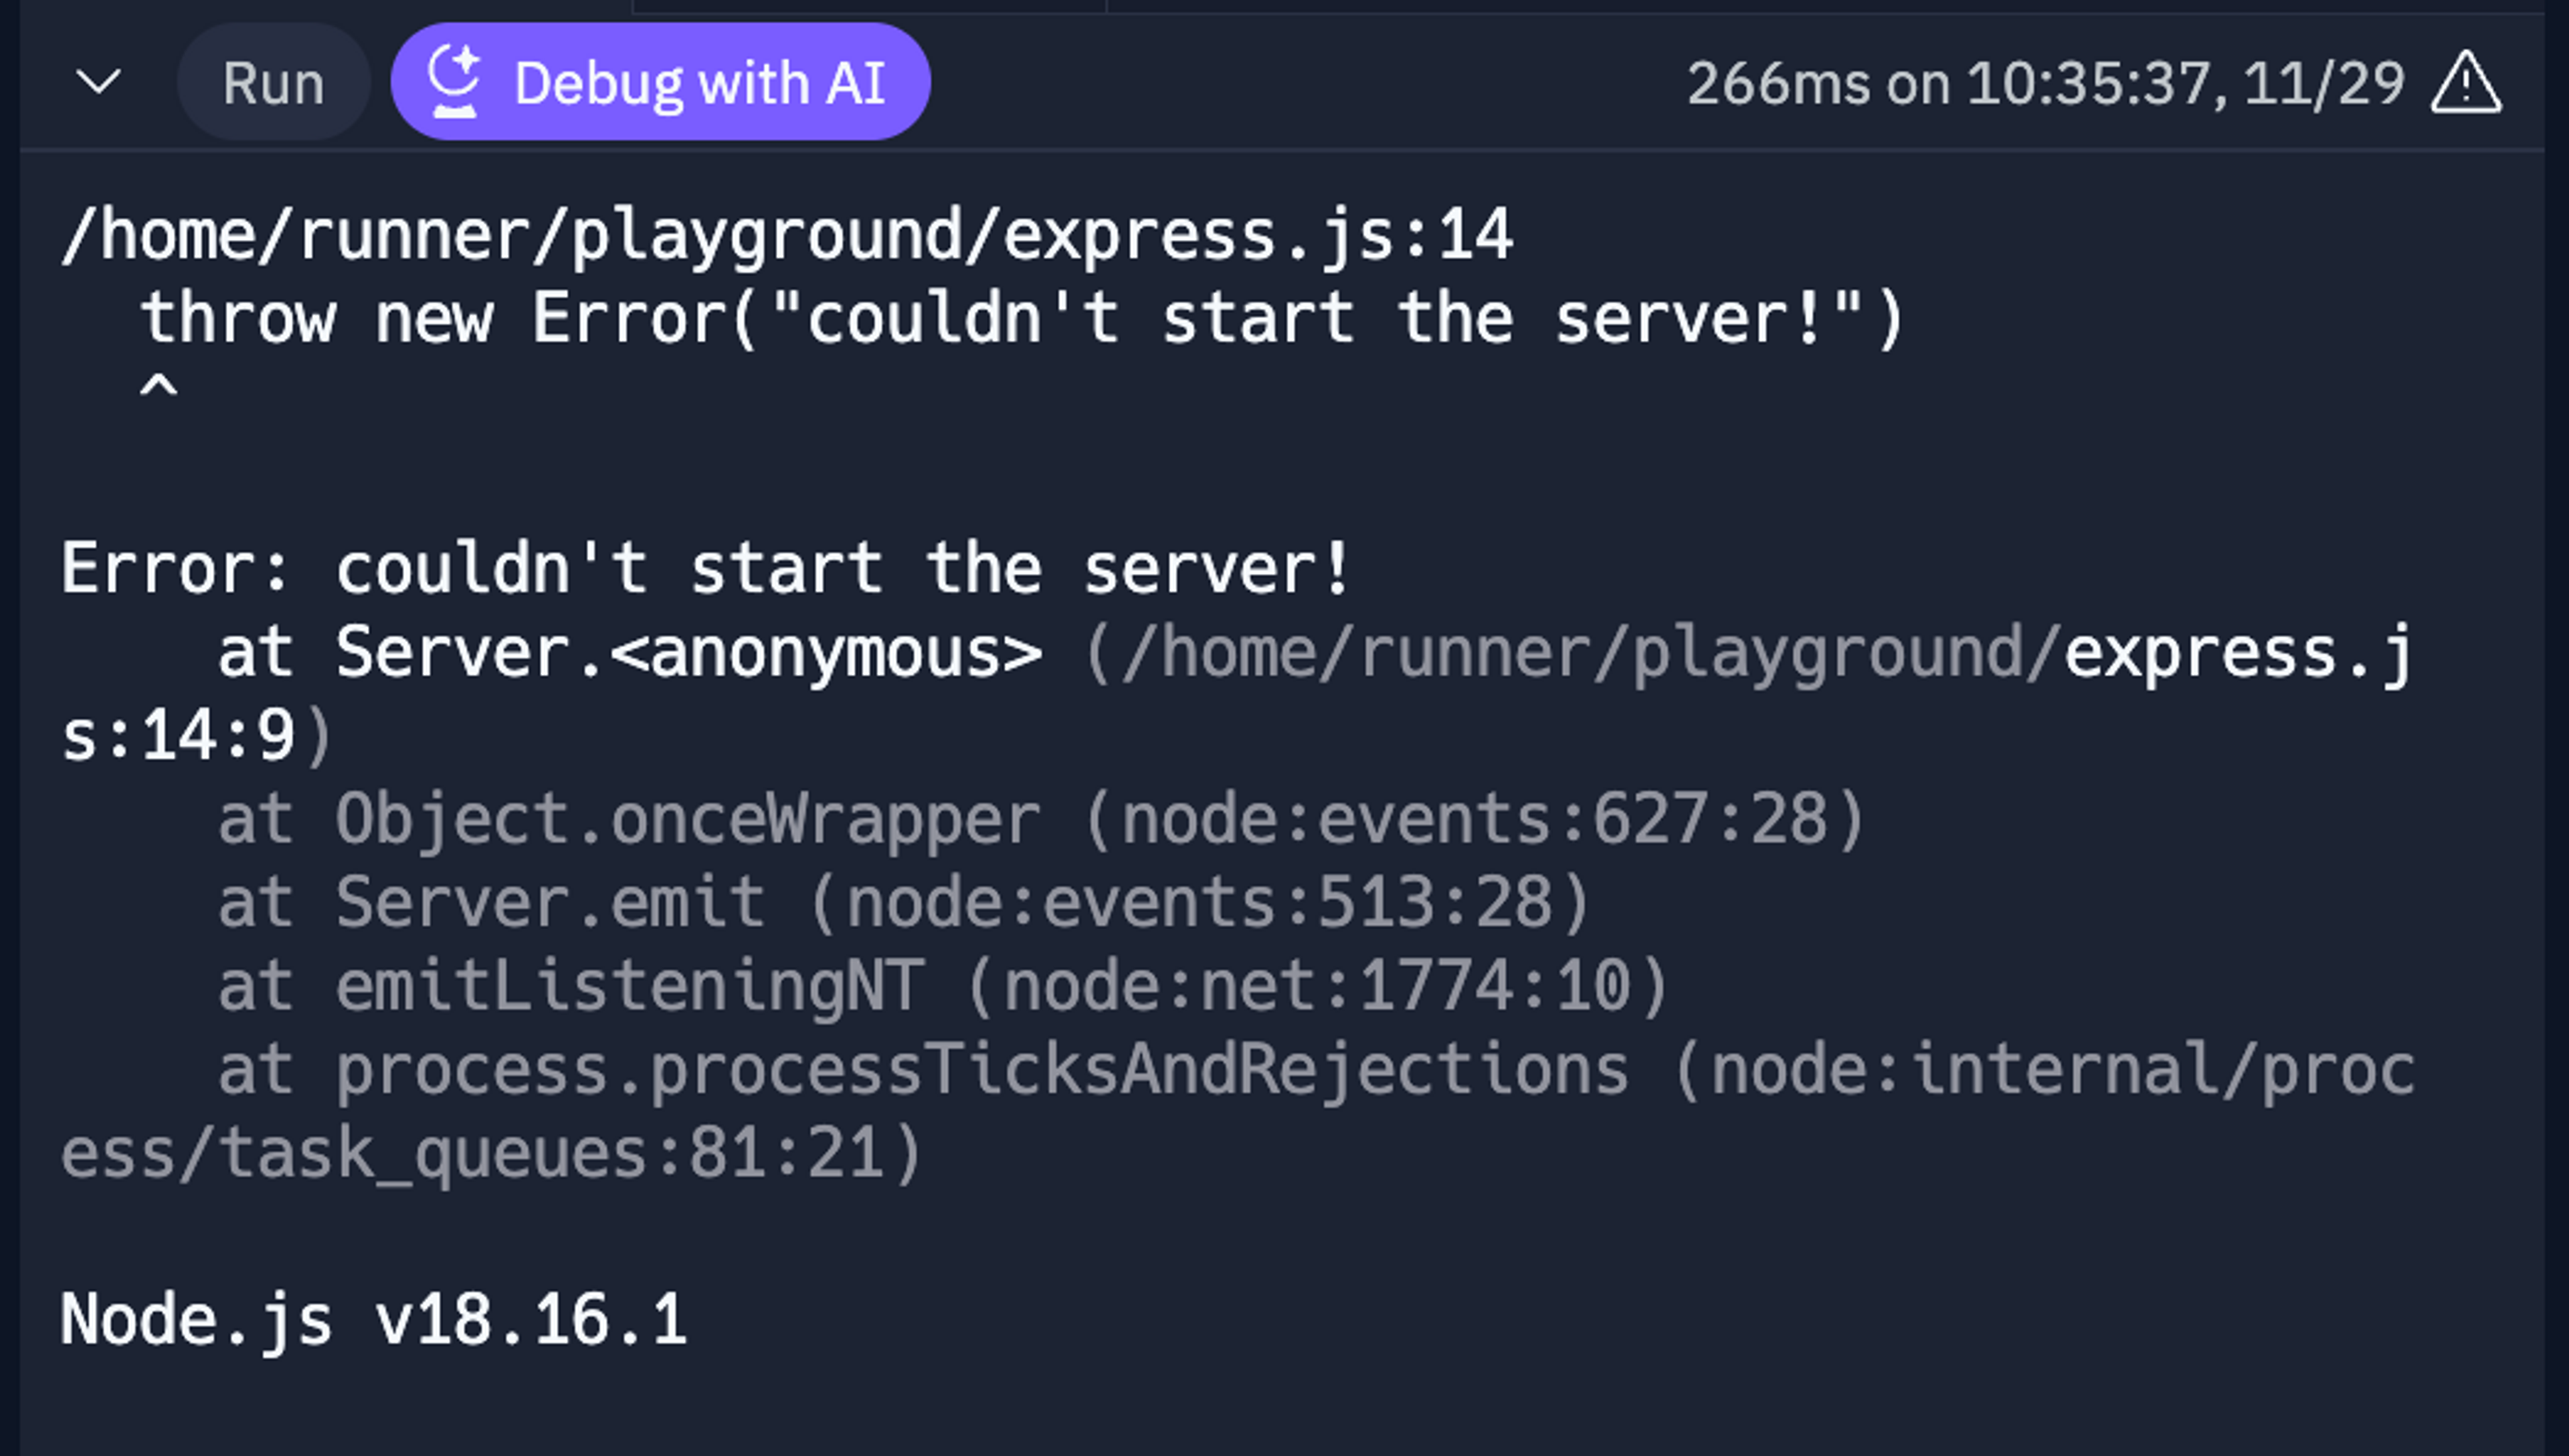
Finally, if you ever hit an issue in any of these blocks, the AI-powered Debugger is there to help:
Design challenges
Working with terminals
This project's biggest design and engineering challenge was creating new interactions and behaviors around terminals while preserving backward compatibility. For more information about terminals, check out this fun writeup from Julia Evans.
One of the things you might have already noticed is that we grow the blocks as new lines appear:
Historically, terminals are given a size that they can occupy (early on, the full size of the physical terminal screen, and later on, the terminal window size), and if there’s any scrolling, it’s implemented inside of the terminal emulator, not–like here–outside of it.
To implement the behavior of dynamically adjusting the height of the block, we report to the backing PTY the height of the whole Console pane (the full possible space that the terminal could take), but we don’t render the block with the full height in the UI from the start. Instead, we hook into “cursor moved” and “new line added” events from xterm.js (the terminal emulator implementation that we use), track how many non-empty lines are in the terminal buffer, and dynamically adjust the rendered height based on these values.
New blocks stick to the bottom so you always see the new lines that you’ve added, and you can always scroll up to the previous block to see the past:
In the example above, both blocks have fewer lines than the pane height allows, but what happens if we get a lot of output?
We can’t grow the backing terminal size indefinitely, as we very quickly hit the maximum allowed texture size in browsers (xterm.js renders with WebGL). A quick back-of-the-envelope-calculation: maximum texture size for Chrome is 4096px × 4096px (at the time of writing this), and for an 18px cell height, we can only have about 220 lines of scrollback (stored historical lines) before we hit the limit.
Our internal scrollback is much larger, so we needed a different approach: when we detect that we hit the limit of visible lines in the backing terminal, we stop growing its height, and the internal scrollback implementation of xterm.js kicks in. We override mouse scroll events in the pane, scrolling the inside of the terminal when it’s fully occupying the view and scrolling outside of it into past evaluations when we get to the edge of the terminal – a sort of virtualized scrolling:
(Notice how the last block scrolls by lines, and past blocks scroll in as we get to the edge)
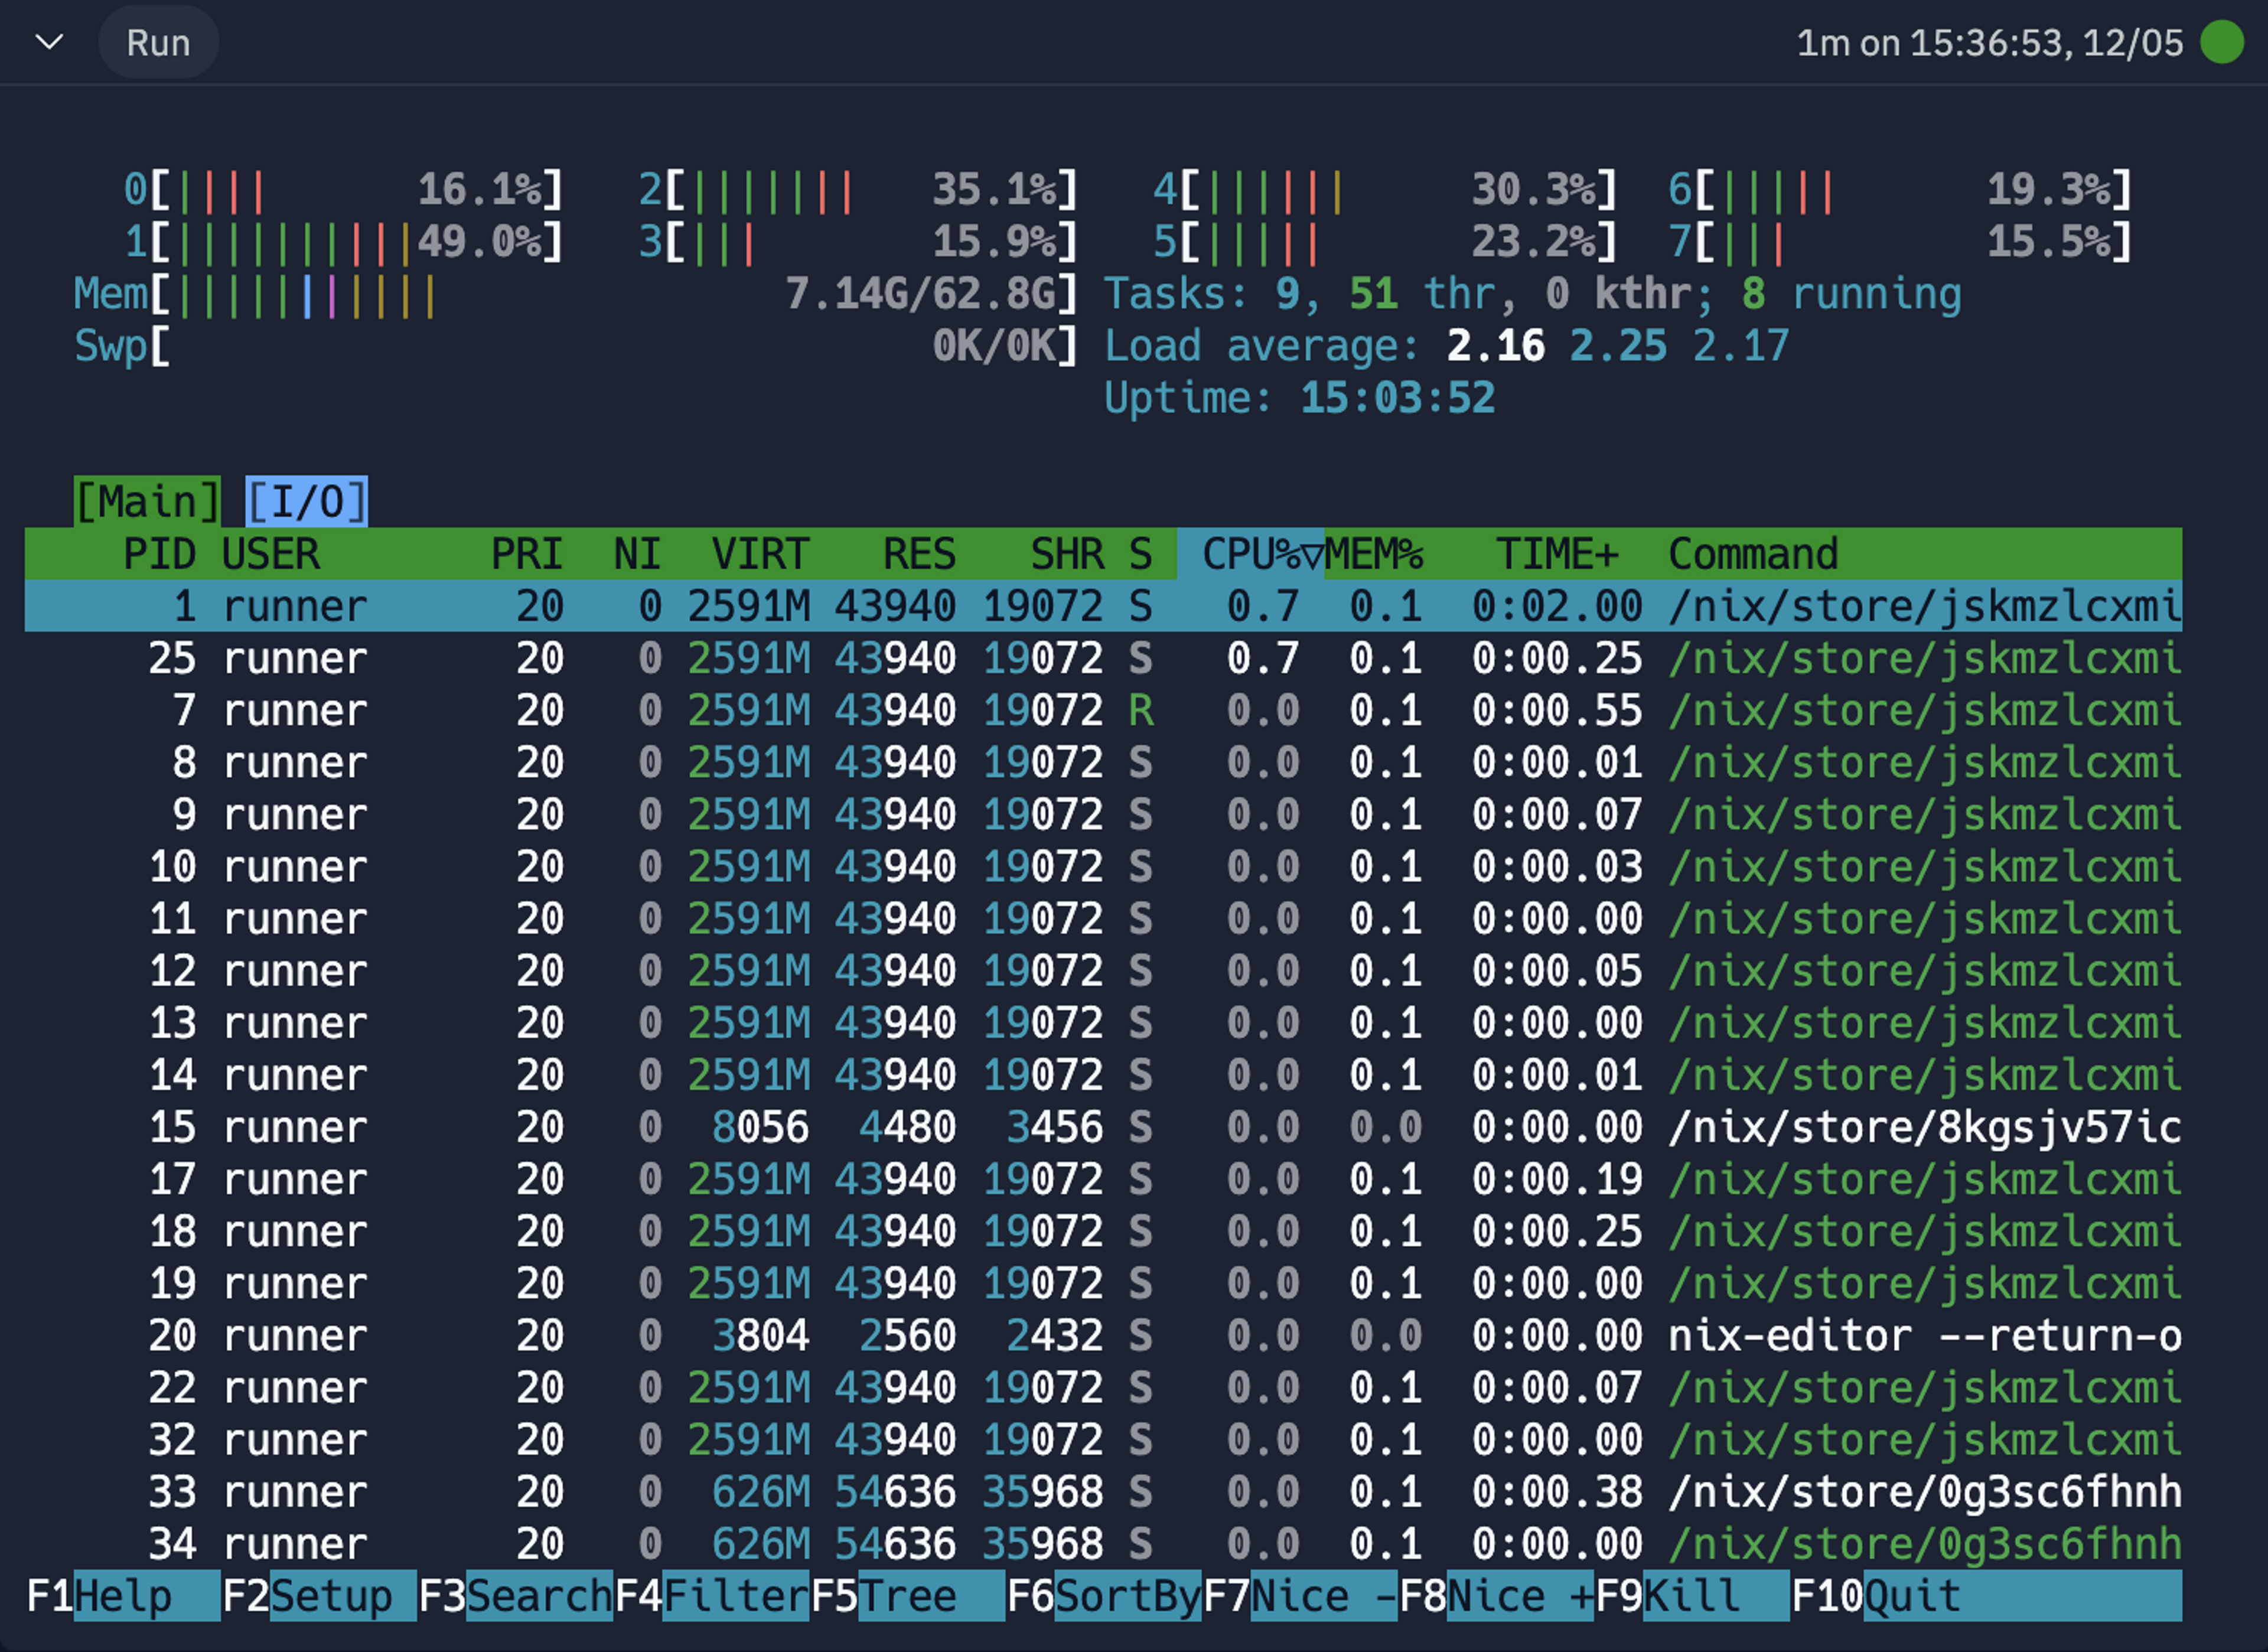
The final piece of the growing-scrolling puzzle is supporting Alternate Screen Buffers, which are used for handling full-screen terminal applications like htop, mutt, vim, and more. While using them as part of the “run” is probably an edge case, we want to support being able to develop these kinds of applications on Replit, too – in that case, we just give them the full space that the block can take from the start:
Ultimately, this behavior should be completely transparent for you, unless you come looking for it, which is great – all these details are necessary but disappear into the background as you’re working on your code.
What does it mean to run?
Building the new Console forced us to revisit what it means for a Repl to be “running” and the interactions between the green “Run” button and the Console UI. Previously, it wasn’t always clear when the Console was running something, and when it was in “interpreting” mode, technically still “running,” but with the Repl being in a “stopped” state.
We decided to simplify these interactions: when some process is running in the Console – be it your code being executed, debugged, or an interactive interpreter running – the Repl is also considered to be running. When the process stops or crashes, the Repl is no longer in a running state.
Reliable stopping
We believe that user experience comes not only from the graphical interface but also from how the system behaves as a whole. At Replit, “end-to-end” is pretty wide – on one side, we have an operating system, which we have full control over (including our own implementation of pid 1), and on the other – our IDE running in the browser. This gives us a unique position to design the user-facing behavior in a way that’s impossible with a local editor.
One great example is the behavior of running arbitrary code and being certain that clicking “Stop” will actually stop it. A lot of popular programming tools (formatters, type-checkers, bundlers, etc.) spawn sub-processes to take advantage of multiple CPUs – which is great for performance but can cause issues if not all of them exit cleanly – possibly resulting in detached processes taking up resources, and often resulting in hard to debug issues (CPU and RAM usage topping out, ports not being freed, etc.).
To solve this, we run each code block in its own execution context, backed by Control Groups. This allows us to capture all spawned sub-processes for the block by dynamically creating new cgroup scopes and ensuring that “Stop” truly stops everything. Building a feature like this is only really possible because we have full control over the environment in which the code executes, something that would be impossible to do well in a local IDE that cannot make any assumptions about the context in which it runs.
What’s next?
The new Console brings with it a lot of generative potential for new features.
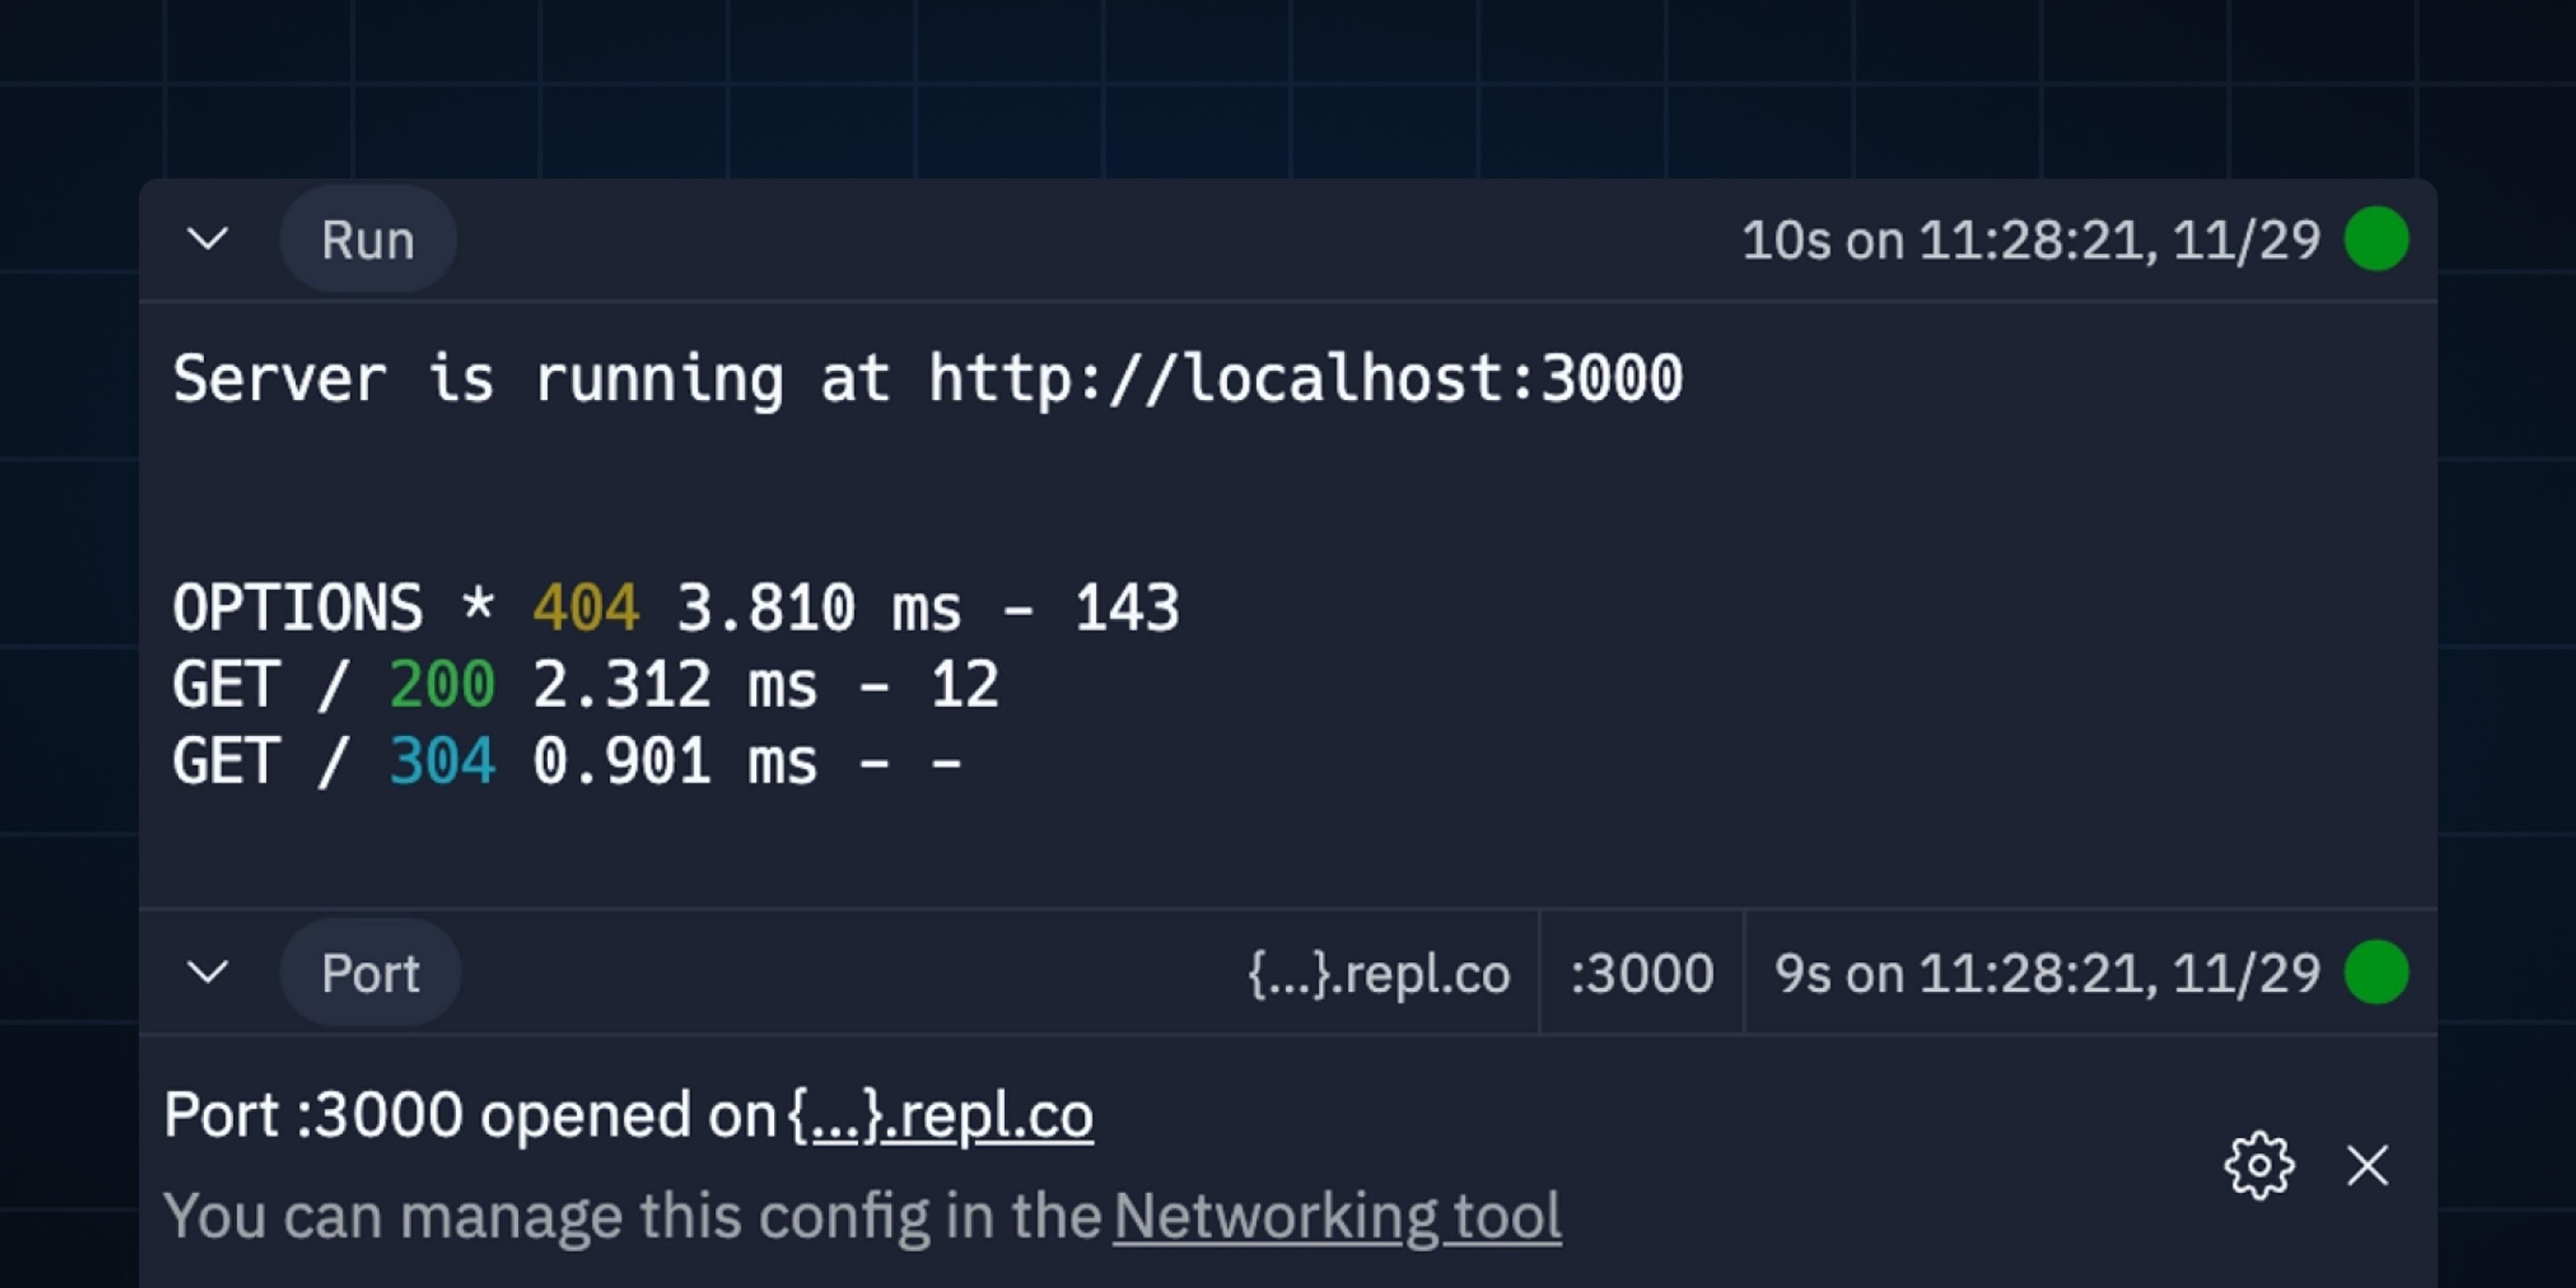
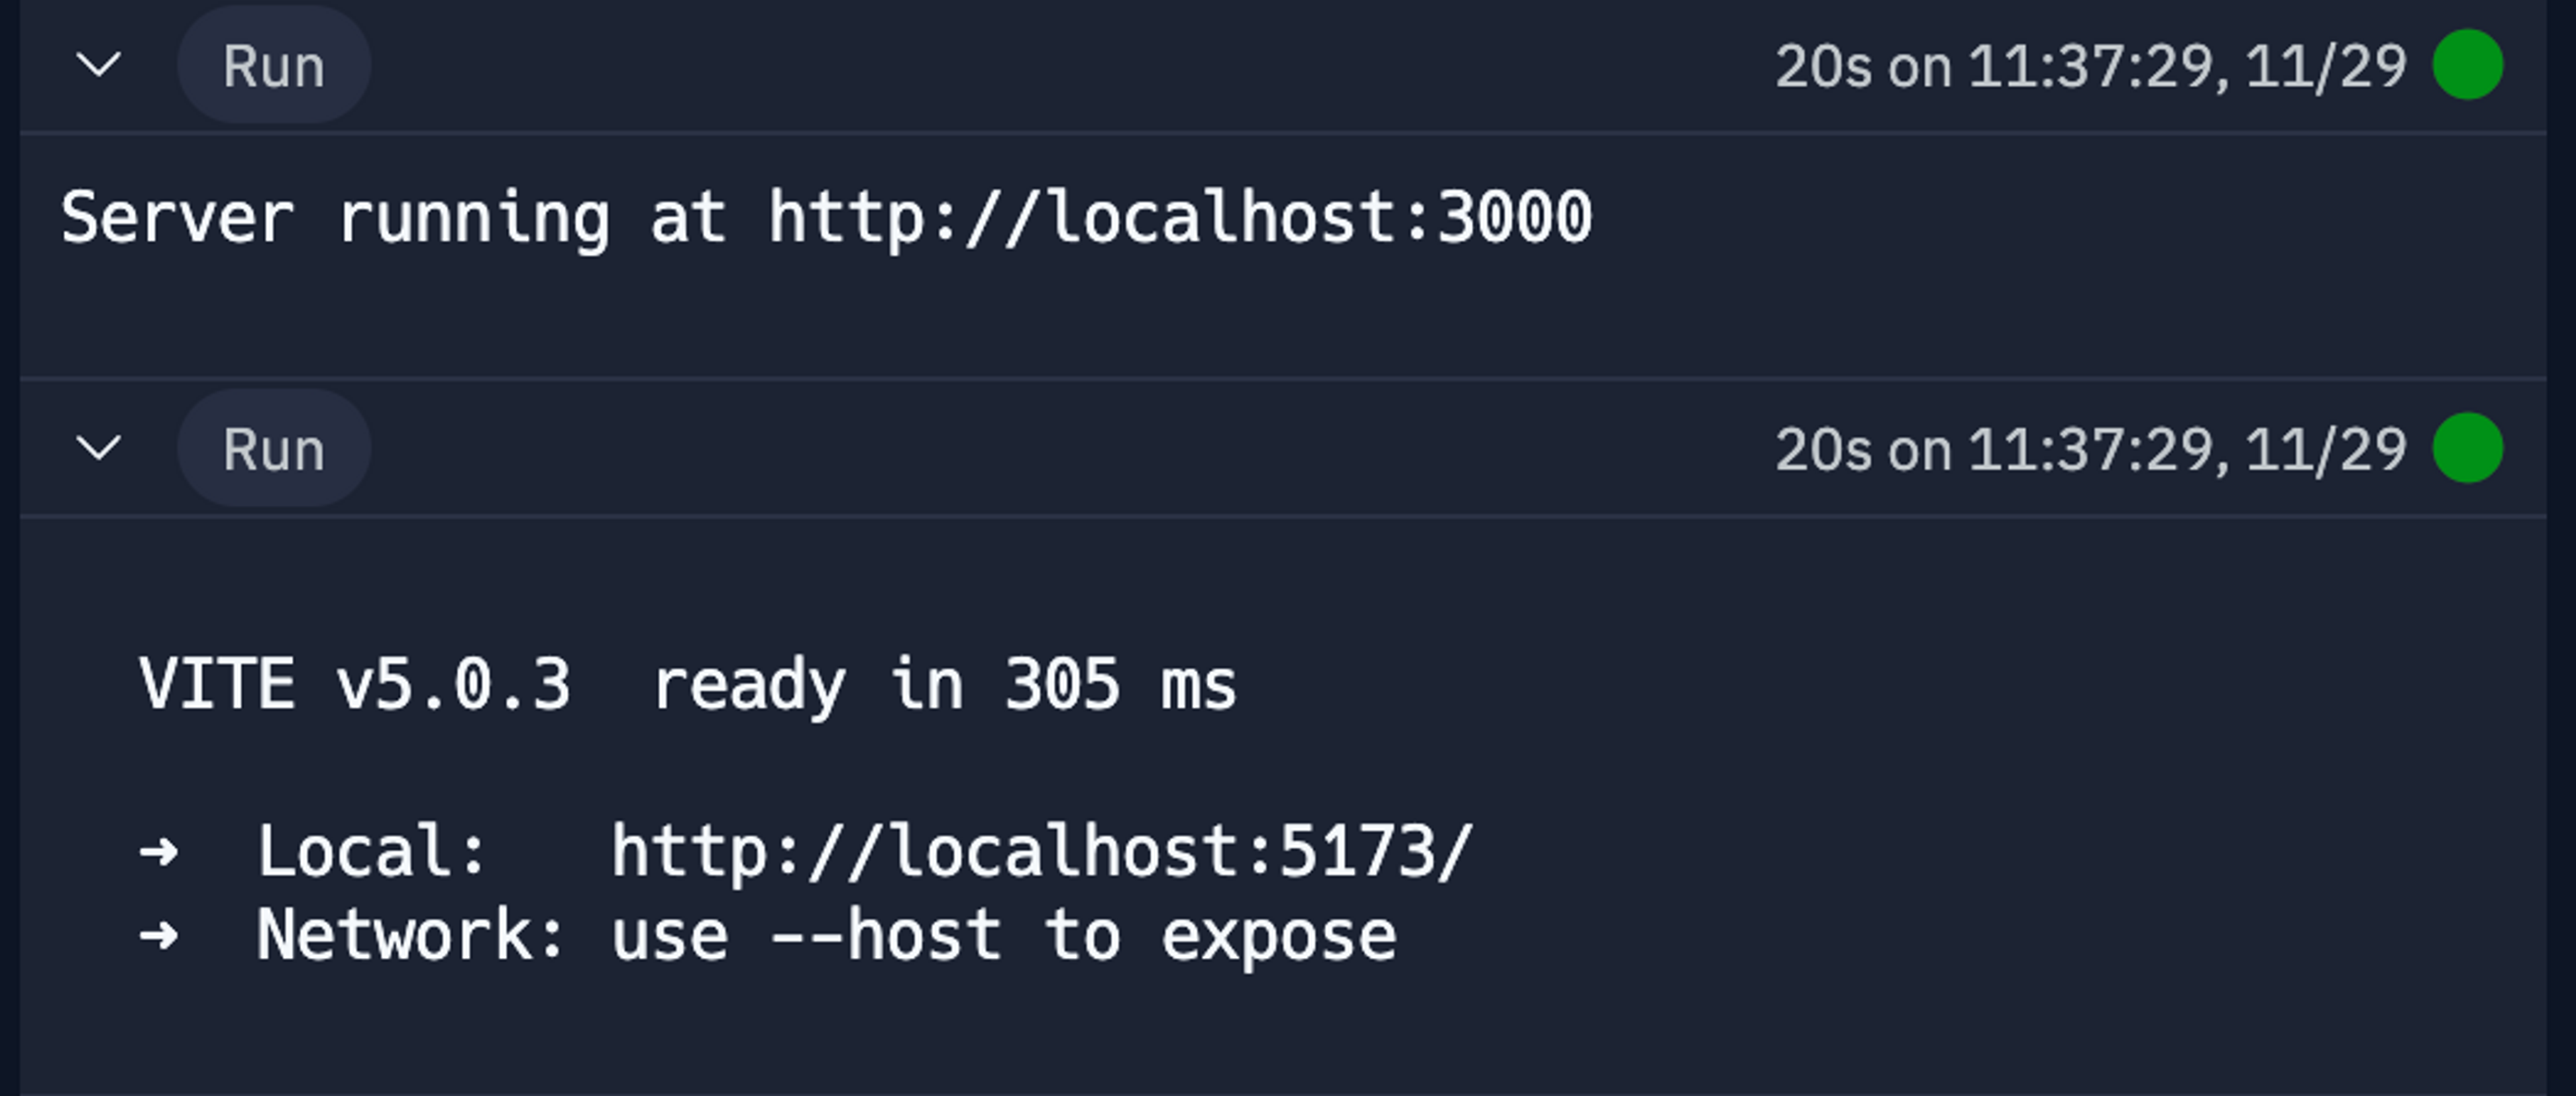
We are already exploring running multiple blocks at the same time (imagine having a separate frontend and server code in the same Repl):
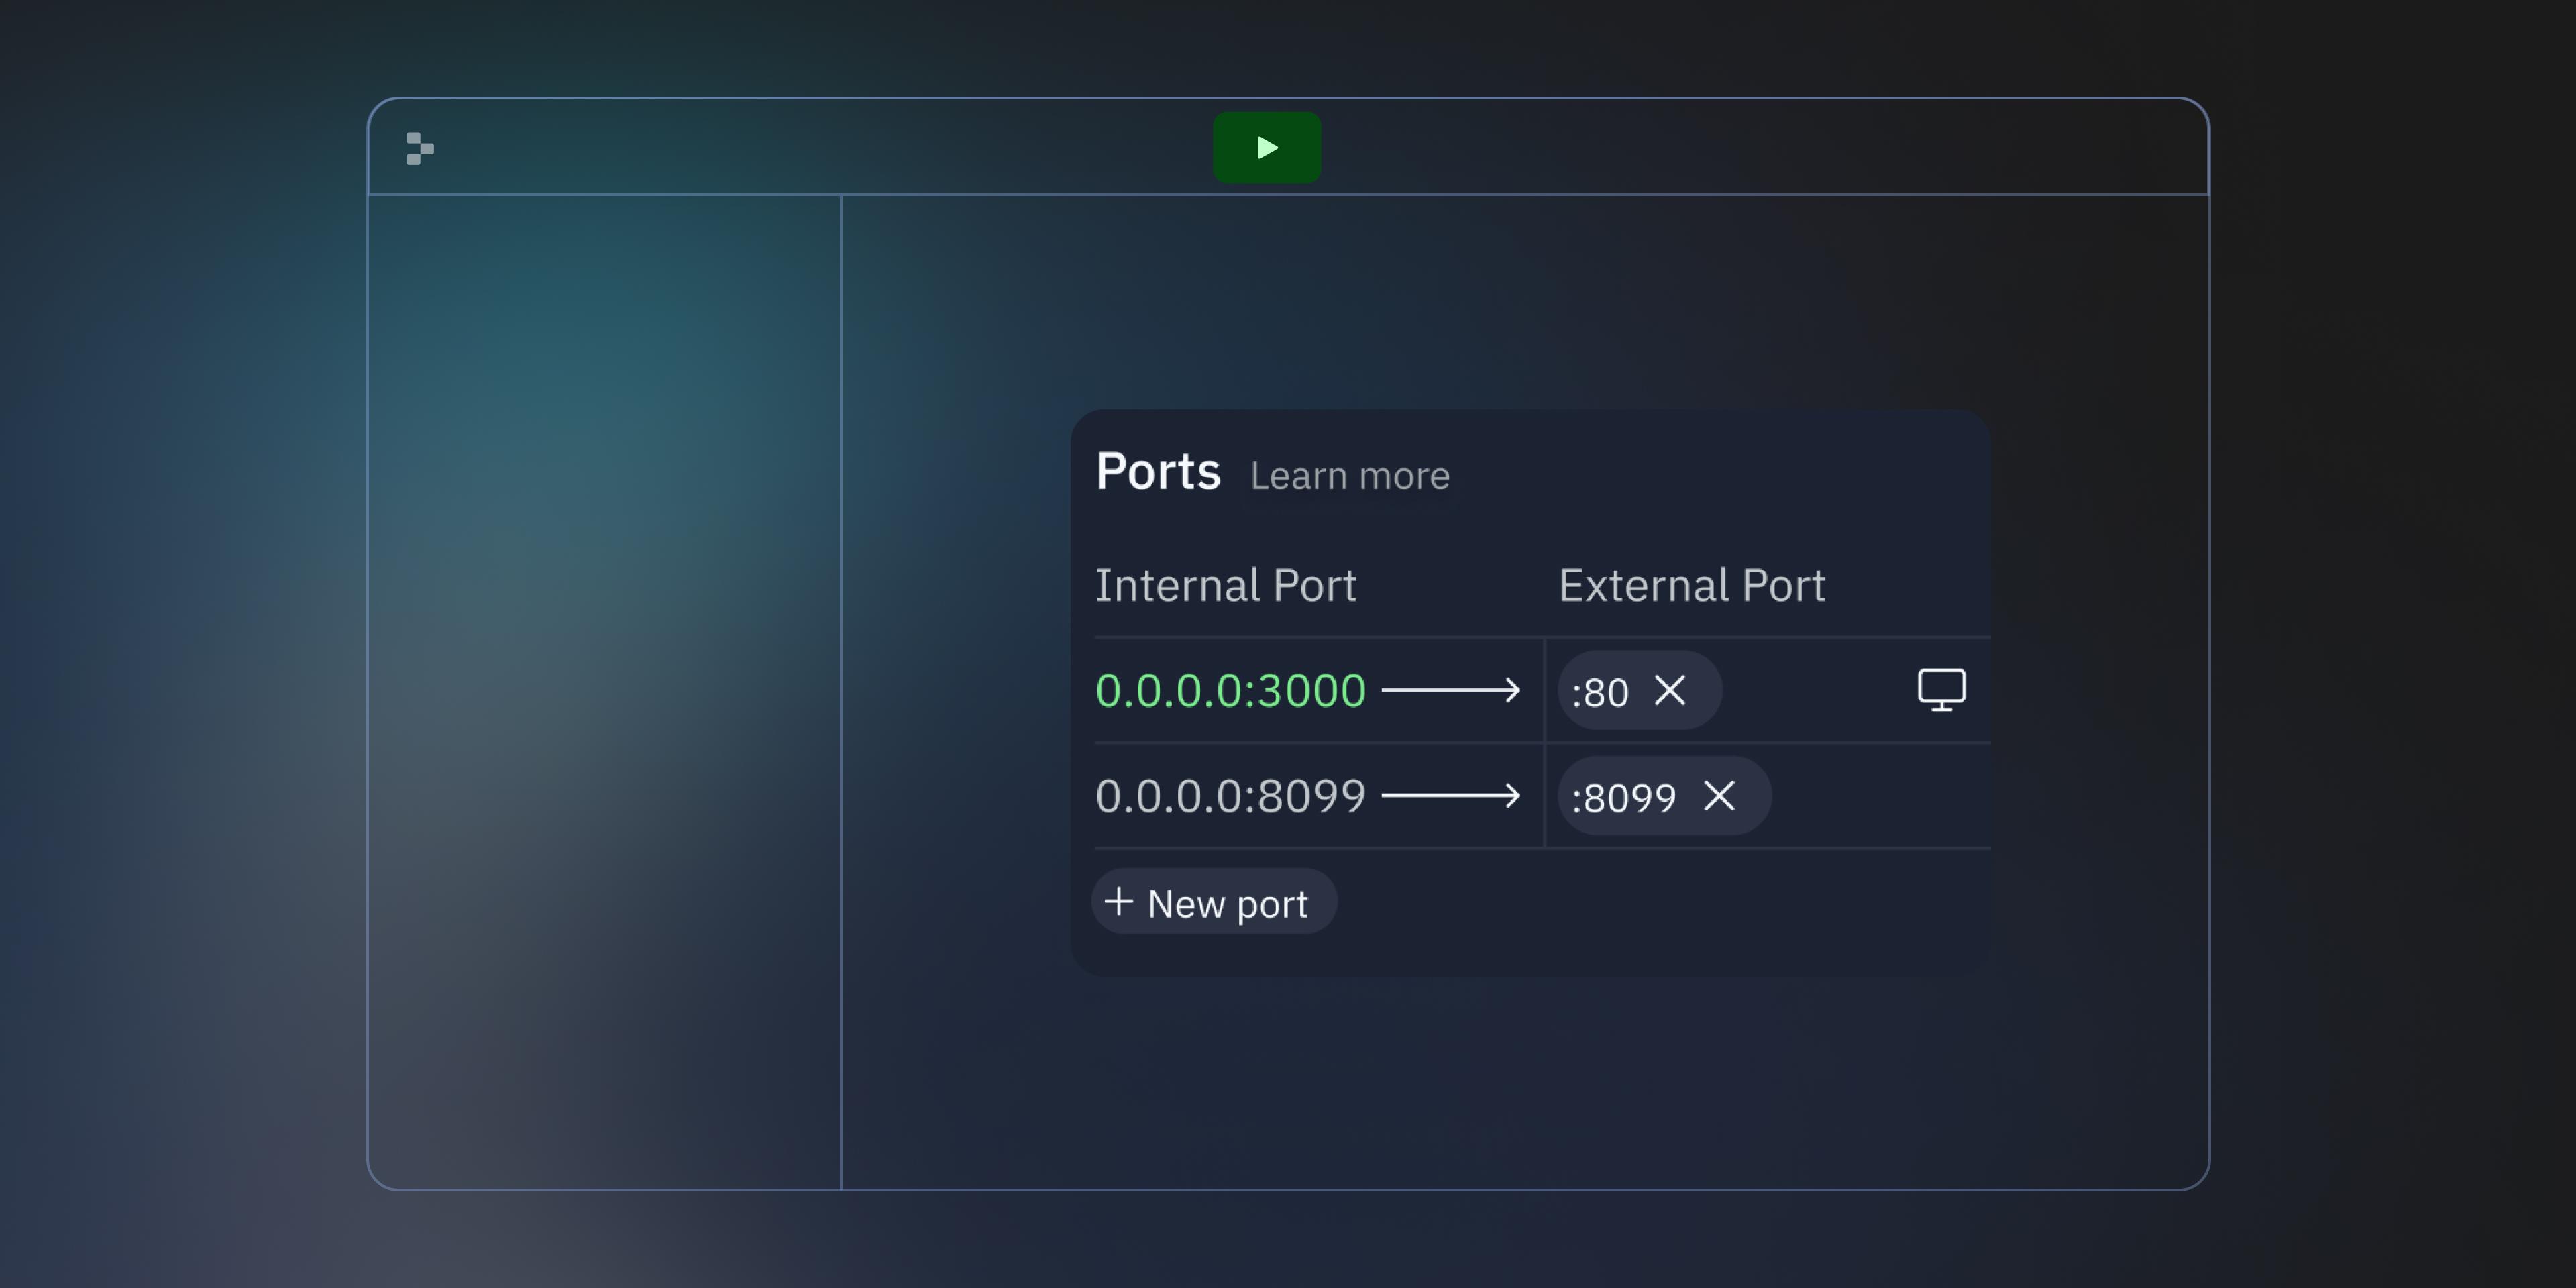
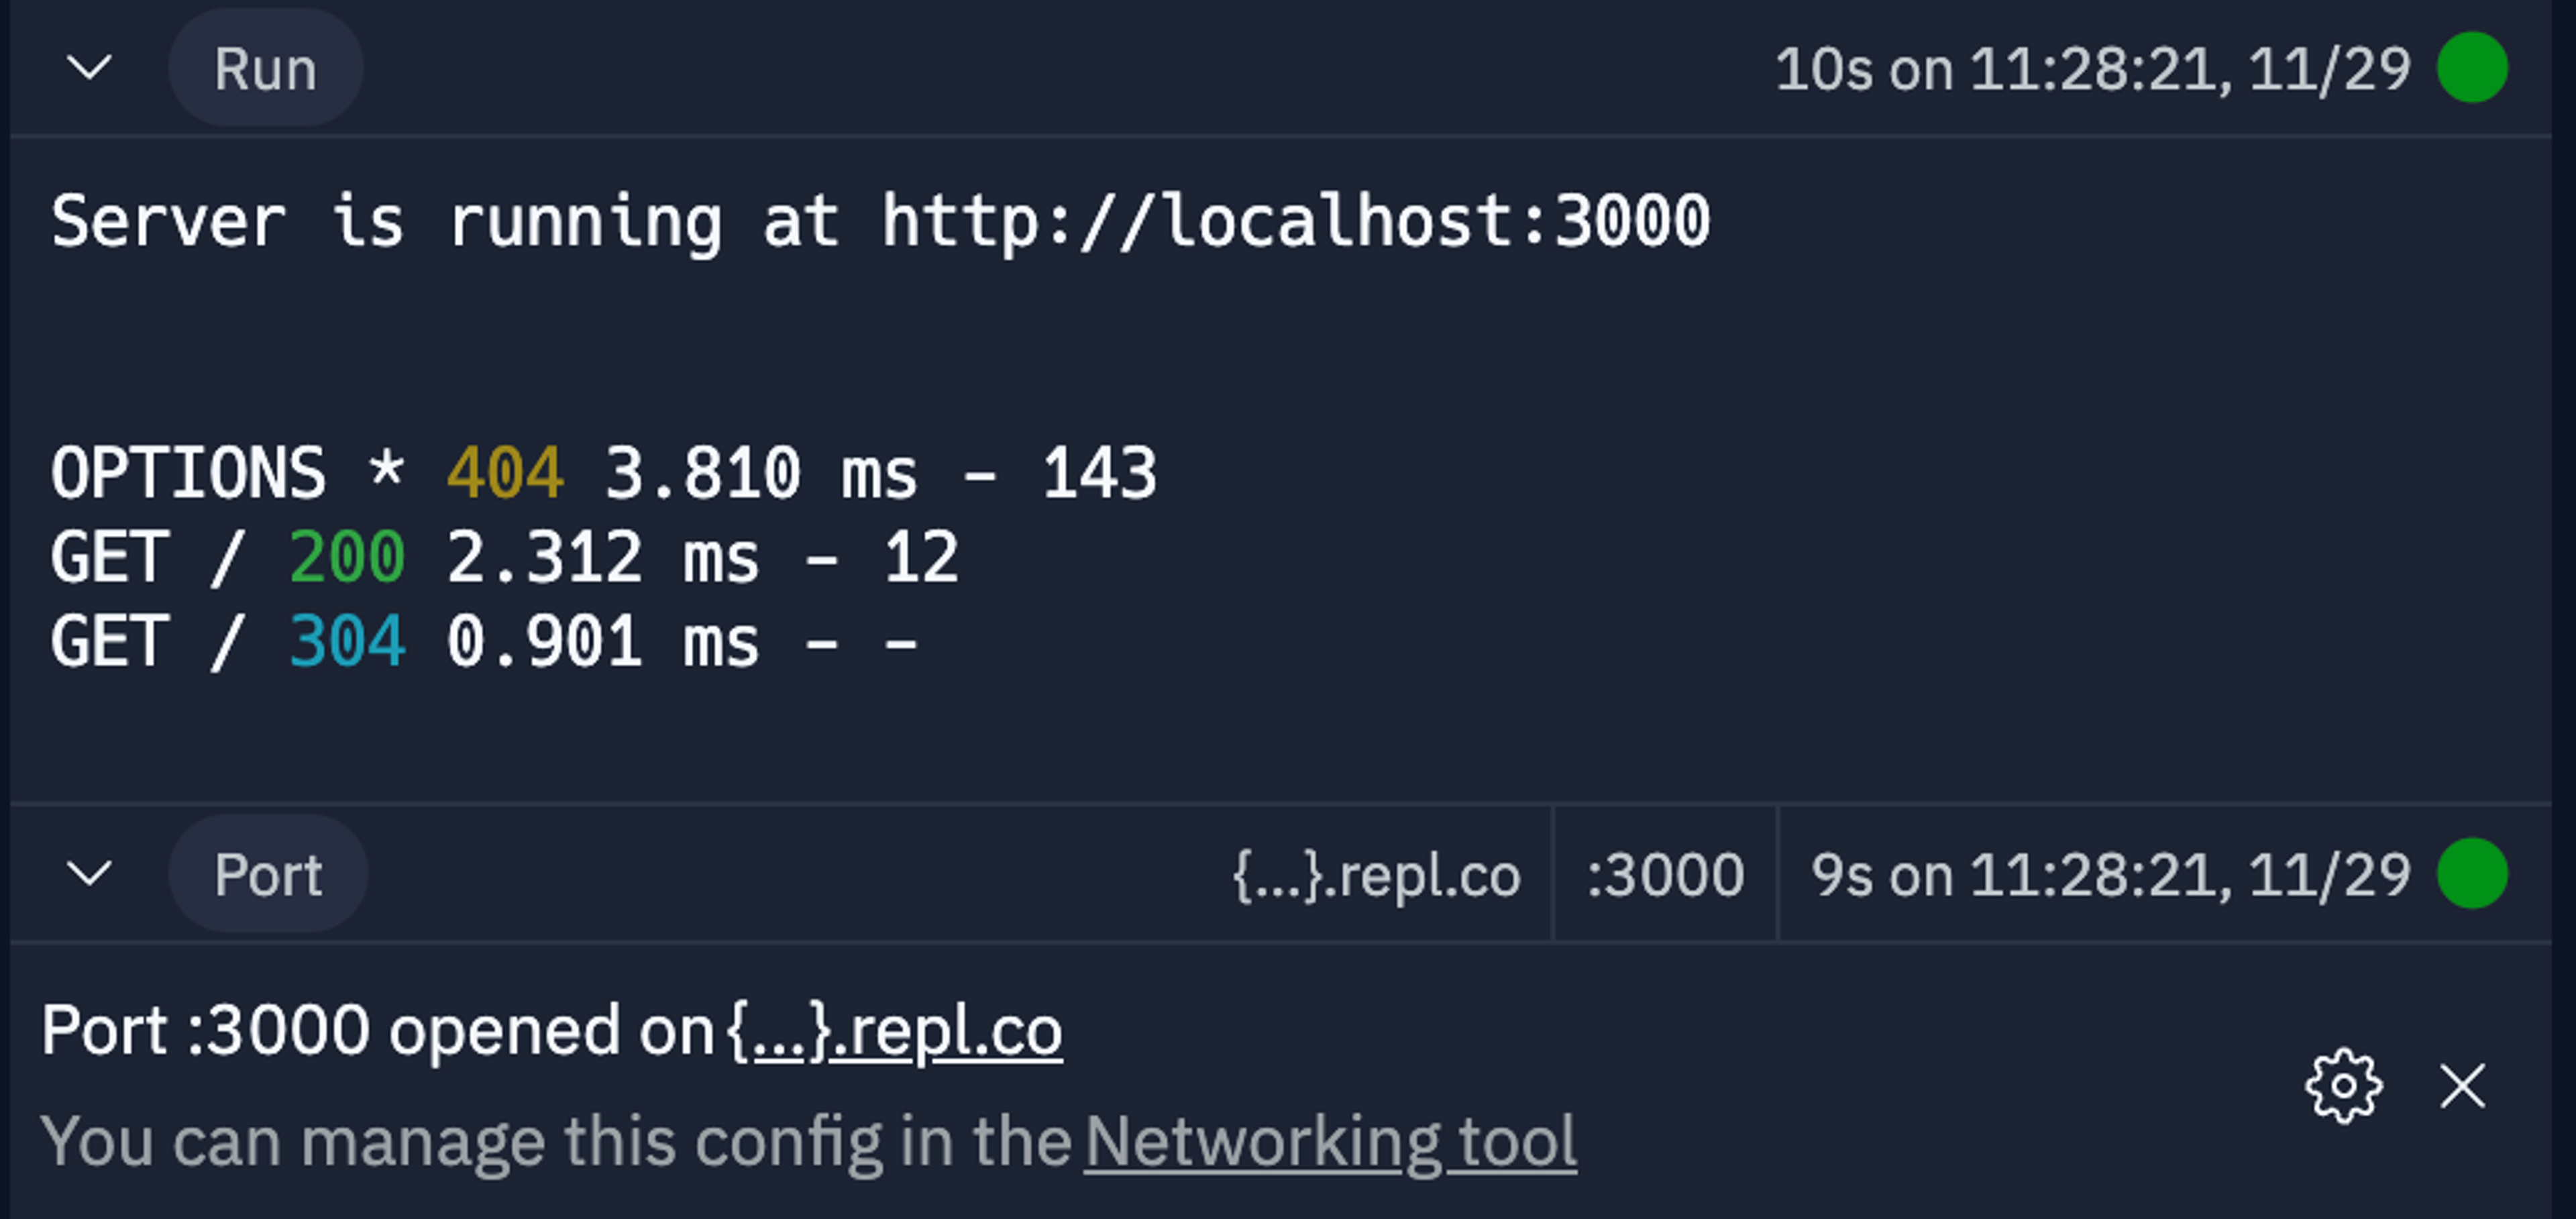
…or surfacing additional metadata, like opened Ports:
Are you interested in designing and building features like this one? We’re hiring!